lisc.plts.counts.plot_clustermap
- lisc.plts.counts.plot_clustermap(data, x_labels=None, y_labels=None, attribute='score', transpose=False, method='complete', metric='cosine', cmap='purple', **kwargs)[source]
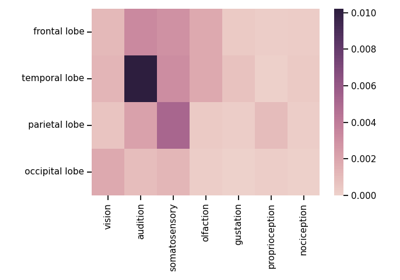
Plot a clustermap of the given data.
- Parameters:
- dataCounts or 2d array
Data to plot, as a clustermap.
- x_labelslist of str, optional
Labels for the x-axis.
- y_labelslist of str, optional
Labels for the y-axis.
- attribute{‘score’, ‘counts’}, optional
Which data attribute from the counts object to plot the data for. Only used if the data input is a Counts object.
- transposebool, optional, default: False
Whether to transpose the data before plotting.
- methodstr, optional, default: ‘complete’
The linkage algorithm to use. See scipy.cluster.hierarchy.linkage for options.
- metricstr or function, optional, default: ‘cosine’
The distance metric to use. See scipy.spatial.distance.pdist for options.
- cmap{‘purple’, ‘blue’} or matplotlib.cmap
Colormap to use for the plot. If string, uses a sequential palette of the specified color.
- **kwargs
Additional keyword arguments to pass through to seaborn.clustermap.
Notes
This function is a wrapper of the seaborn.clustermap plot function.
Examples
See the example for the
compute_score()method of theCountsclass.