lisc.plts.counts.plot_matrix
- lisc.plts.counts.plot_matrix(data, x_labels=None, y_labels=None, attribute='score', transpose=False, cmap='purple', square=False, ax=None, **kwargs)[source]
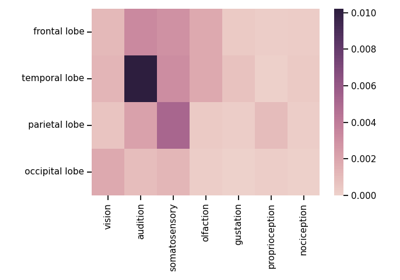
Plot a matrix as a heatmap.
- Parameters:
- dataCounts or 2d array
Data to plot in matrix format.
- x_labelslist of str, optional
Labels for the x-axis.
- y_labelslist of str, optional
Labels for the y-axis.
- attribute{‘score’, ‘counts’}, optional
Which data attribute from the counts object to plot the data for. Only used if the data input is a Counts object.
- transposebool, optional, default: False
Whether to transpose the data before plotting.
- cmap{‘purple’, ‘blue’} or matplotlib.cmap
Colormap to use for the plot. If string, uses a sequential palette of the specified color.
- squarebool, optional, default: False
Whether to plot all the cells as equally sized squares.
- axmatplotlib.Axes, optional
Figure axes upon which to plot.
- **kwargs
Additional keyword arguments to pass through to seaborn.heatmap.
Notes
This function is a wrapper of the seaborn heatmap plot function.
Examples
See the example for the
compute_score()method of theCountsclass.