lisc.plts.time.plot_results_across_years
- lisc.plts.time.plot_results_across_years(results, ax=None, **plt_kwargs)[source]
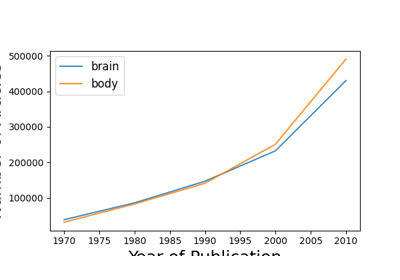
Plot counts data from across years.
- Parameters:
- resultsdict
Results collected across time. Each key should reflect the start year, and each value is a object with search results.
- axmatplotlib.Axes, optional
Figure axes upon which to plot.
- plt_kwargs
Additional keyword arguments for the plot.